1.3 Structured Data: Event driven bars
This post will describe how to process & store High Frequency financial data to support your Machine Learning Algorithm, based on events that happen in the data
The post is directly based on content from the book "Advances in Financial Machine Learning" from Marcos Lopez de Prado
Physical meaning:
The inspiration for event driven bars, is really Control Theory, where control limits (upper & lower) are placed around the mean outcome of a particular system. The outcome of a system will be variable, but the system is determined to be in control if the outcome remains within these upper & lower control limits. When the system is outside these limits, the system is determined to be out of control, and demands attention.
In event driven bars, we attempt to compress the financial data, by sampling only when some valuable financial outcome is achieved, e.g. a target level of return is achieved, or a spike in volatility happens. Here, we know that financial data is inherently noisy, and put thresholds around what level of the financial outcome, interests us. It is only when the financial outcome exceeds these thresholds, that we start sampling, as this represents new information. In this way, instead of de-facto sampling every 2000 ticks, we might sample one time for the first 1900 ticks, and ten times for the next 100 ticks, because the markets were very volatile in the last 100 ticks. This technique smartly rations your data samples to when you need finer discrimination.
The end goal remains the same, how do you faithfully capture as much as what happened, with as little data storage used as possible.
Algorithm description:
In the event driven bar, specifically, the Symmetric Cusum filter, we sample when the absolute return, exceeds a threshold value x, in either the positive or negative direction.
In the event driven bar, the variable we monitor, tick by tick absolute return, can be positive or negative. The variable increases/decreases by the absolute return, on each consecutive tick. When the variable (cumulative sum) exceeds a threshold (positive/negative), we determine to be interesting, then we sample the bar.
We usually set up two variables, so that we set different thresholds, and target actions, based on whether the cumulative sum is positive or negative. Exceeding a negative threshold return would be interesting to you if you are in a short position.
The physical meaning is that if you were to invest money at a particular level, and you determined to exit after an upward/downward move of x dollars, based on whether you were long/short the position. The algorithm used has a zero floor, because if the absolute return were to turn negative, we can always the exit the position, and re-enter the position at the initial level. The only thing that is ignored here is the time value of money. A similar explanation applies on the negative side.
The algorithm is self-resetting because we an absolute return, and not a threshold price, to trigger the sampling.
Python code:
# Import Libraries
import numpy as np
import pandas as pd
import matplotlib.pyplot as plt
# Import data
df = pd.read_csv(r'C:\Users\josde\OneDrive\Denny\Deep-learning\Data-sets\Trade-data\ES_Trades.csv')
df = df.iloc[:, 0:5]
df['Dollar'] = df['Price']*df['Volume']
# Generate variable
delta = np.diff(df['Price'])
delta = np.insert(delta,0,0)
df['Delta'] = pd.DataFrame(delta)
# function to identify event breaks
def getEvents(df, thresh):
sPos, sNeg = 0, 0
tEvents = []
collector = []
event_bar=[]
for i, (delta,price) in enumerate(zip(df['Delta'],df['Price'])):
sPos, sNeg = max(0,sPos + delta), min(0,sNeg + delta)
collector.append(price)
if sPos >= thresh:
sPos = 0; tEvents.append(i)
o,h,l,c = collector[0],np.max(collector),np.min(collector),collector[-1]
event_bar.append((i,o,h,l,c))
collector=[]
elif sNeg < -thresh:
sNeg = 0; tEvents.append(i)
o, h, l, c = collector[0], np.max(collector), np.min(collector), collector[-1]
event_bar.append((i,o,h,l,c))
collector = []
cols = ['Index','Open','High','Low','Close']
event_bar=pd.DataFrame(event_bar,columns=cols)
return tEvents, event_bar
tEvents, event_bar = getEvents(df,thresh=2)
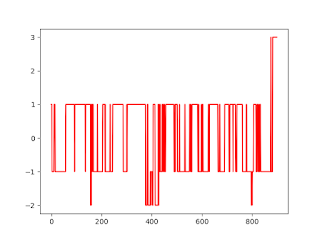
# Plot bars
plt.figure(1)
plt.plot(event_bar['Open'],'r')
plt.show()
Comments
Post a Comment