Posts

Showing posts with the label Code Base

PyCharm Productivity Hacks

This post will describe some hacks to improve your productivity on Machine Learning projects. This post is scoped around Python development in the PyCharm IDE.  Scientific Mode: This feature is only available on the Professional Version of PyCharm. Code blocks: Using # %%  at the start of a code block, creates a cell, similar to a cell in Jupyter. You will then have access to a dedicated play button for that cell, allowing you to prototype commands quickly without having to run the entire code block. This adds value when you have a load function in your code, which will take up time to run View variable: You are able to view a sample of the data you have just loaded, and are able to see a plot of that data. This feature is useful during the data exploration stage, as you are trying to build hypothesis. In-line visualisation: You can see the results of cell commands such as seaborn or matplotlib, in line, just by running a cell. Not having to run the entire program, leading to ...
2.2 Labeling: Triple barrier method

Image
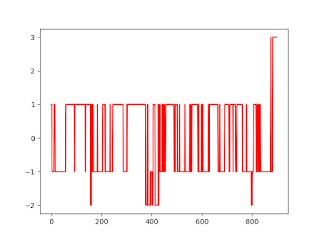
 This post will describe how to label a financial dataset to support supervised learning The post is directly based on content from the book "Advances in Financial Machine Learning" from Marcos Lopez de Prado Physical meaning: Algorithm description: Python code: # Import libraries import numpy as np import pandas as pd import matplotlib.pyplot as plt import math # Import data df = pd.read_csv( r'C:\Users\josde\OneDrive\Denny\Deep-learning\Data-sets\Trade-data\ES_Trades.csv' ) df = df.iloc[: , 0 : 5 ] df[ 'Dollar' ] = df[ 'Price' ] * df[ 'Volume' ] print (df.columns) # Generate thresholds d = pd.DataFrame(pd.pivot_table(df , values = 'Dollar' , aggfunc = 'sum' , index = 'Date' )) DOLLAR_THRESHOLD = ( 1 / 50 ) * np.average(d[ 'Dollar' ]) # Generate bars def bar_gen (df , DOLLAR_THRESHOLD): collector , dollarbar_tmp = [] , [] dollar_cusum = 0 for i , (price , dollar) in enumerate ( zip (df[ 'Price...

2.1 Labeling: Fixed Horizon Method

Image
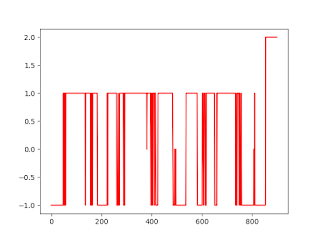
This post will describe how to assign labels to bars (financial features) to support supervised learning. Upon successful training, the algorithm will be able to predict the probability of a label once a bar (financial feature) has been observed. The post is directly based on content from the book "Advances in Financial Machine Learning" from Marcos Lopez de Prado Physical meaning: Algorithm description: Python code: import numpy as np import pandas as pd import matplotlib.pyplot as plt # Import data df = pd.read_csv( r'C:\Users\josde\OneDrive\Denny\Deep-learning\Data-sets\Trade-data\ES_Trades.csv' ) df = df.iloc[: , 0 : 5 ] df[ 'Dollar' ] = df[ 'Price' ]*df[ 'Volume' ] # Generate thresholds d = pd.DataFrame(pd.pivot_table(df , values = 'Dollar' , aggfunc = 'sum' , index = 'Date' )) DOLLAR_THRESHOLD = ( 1 / 50 )*np.average(d[ 'Dollar' ]) # Generate bars def bar_gen (df , DOLLAR_THRESHOLD): collector , dollarb...

The secret to labeling financial data

This post will describe the secret of labeling financial data To avoid the curse of dimensionality, it is advisable to reframe a regression problem into a classification problem where possible.  Fixed horizon method: Fixed horizon method is a popular method to do this. There are two components to this, a. generating the fixed horizon, and b. labeling the data. Generating the fixed horizon is done through the use of bars, time bars/tick bars/volume bars/dollar bars. The bars other than time bars are preferred because the return series is closer to the normal distribution. Labeling the data is done by setting up a return threshold, t. If the return, r, over a fixed number of bars is less than -t, label the bar as -1, between -t and t label 0, and beyond t label 1 A variation of the above method, that is very appealing, is to replace the raw return r with the standardised return z, which is the return that is adjusted for the volatility predicted over the interval of bars we are calcu...

Normalised Mutual information replaces Correlation

Image
The objective of this post is to introduce normalised Mutual Information as a better metric of co-dependency between two variables Physical meaning: Correlation is a good measure of co-dependency as it is bounded between [0 to 1], and is simple to understand. However, it suffers from a drawback in that it only measures the linear relationship between two variables. If the relationship between two variables is non-linear, as is frequently the case in financial data, we will have low values of correlation, though the variables maybe perfectly predictable using a non-linear function.  Normalised Mutual information is a standardised measure that overcomes these drawbacks. It is based on Information Theory, as opposed to correlation [Linear Algebra], and can accurately quantify the extent to which a relationship exists between two variables [Linear or Non-Linear]. We can then use ML techniques to model the relationship Experimental results: Using Python code below 1. Zero Linear Relatio...

Information Theory approach to estimate a Random variable

Image
This post will describe an Information Theoretic approach to estimating a random variable. This approach again highlights how important Electrical & Electronics Engineering concepts are applicable to Capital Markets. 1. Caveats of correlation: Correlation is not a useful metric of co-dependency between two variables if: If there is a non-linear relationship between the variables If there are significant outliers that skew the correlation metric If the two variables do not jointly follow a bi-variate normal distribution If correlation is judged to be a useful metric instead of its usual form, it is worth using it in a modified form to judge the distance between two metrics 2. Shannon's Information-Theoretic approach: We need a metric that highlights the degree of randomness in a random variable. E.g. the degree of sunlight at a point throughout a 24 hour period is a random variable, but there is a low degree of randomness in this random variable. The entropy in a random variable...