2.1 Labeling: Fixed Horizon Method
This post will describe how to assign labels to bars (financial features) to support supervised learning. Upon successful training, the algorithm will be able to predict the probability of a label once a bar (financial feature) has been observed.
The post is directly based on content from the book "Advances in Financial Machine Learning" from Marcos Lopez de Prado
Physical meaning:
Algorithm description:

Python code:
import numpy as np
import pandas as pd
import matplotlib.pyplot as plt
# Import data
df = pd.read_csv(r'C:\Users\josde\OneDrive\Denny\Deep-learning\Data-sets\Trade-data\ES_Trades.csv')
df = df.iloc[:, 0:5]
df['Dollar'] = df['Price']*df['Volume']
# Generate thresholds
d = pd.DataFrame(pd.pivot_table(df, values='Dollar', aggfunc='sum', index='Date'))
DOLLAR_THRESHOLD = (1/50)*np.average(d['Dollar'])
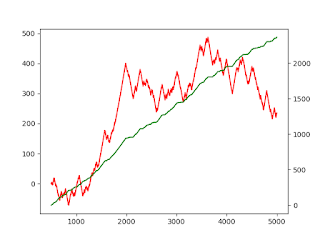
# Generate bars
def bar_gen(df,DOLLAR_THRESHOLD):
collector, dollarbar_tmp = [], []
dollar_cusum = 0
for i, (price, dollar) in enumerate(zip(df['Price'], df['Dollar'])):
collector.append(price)
dollar_cusum = dollar_cusum + dollar
if dollar_cusum >= DOLLAR_THRESHOLD:
o, h, l, c = collector[0], np.max(collector), np.min(collector), collector[-1]
dollarbar_tmp.append((i, o, h, l, c))
o, h, l, c, dollar_cusum = 0, 0, 0, 0, 0
collector = []
cols = ['Index', 'Open', 'High', 'Low', 'Close']
dollarbar = pd.DataFrame(dollarbar_tmp, columns=cols)
return dollarbar
dollarbar = bar_gen(df,DOLLAR_THRESHOLD)
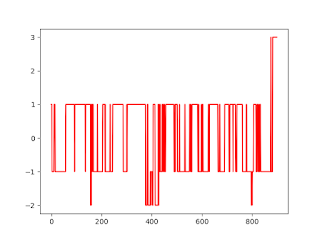
# Generate return labels
def return_label(dollarbar, df, RETURN_THRESHOLD):
labels = 2*np.ones(len(dollarbar['Close']))
for idx, opening_price in enumerate(dollarbar['Close']):
if idx+45 < len(dollarbar['Close']):
closing_price = dollarbar.iloc[idx+45, 4]
dollar_return = (closing_price/opening_price) - 1
if dollar_return > RETURN_THRESHOLD:
labels[idx] = 1
elif dollar_return < -RETURN_THRESHOLD:
labels[idx] = -1
elif dollar_return > -RETURN_THRESHOLD and dollar_return <= RETURN_THRESHOLD:
labels[idx] = 0
dollarbar['Label'] = pd.DataFrame(labels)
return dollarbar
dollarbar = return_label(dollarbar, df, RETURN_THRESHOLD=0.00002)
# Plot results
plt.figure(1)
plt.plot(dollarbar['Label'], 'r')
plt.show()
Comments
Post a Comment