1.1 Structured Data: Standard Bars
This post will describe how to process & store High Frequency financial data to support your Machine Learning Algorithm, based on statistical properties of the data
The post is directly based on content from the book "Advances in Financial Machine Learning" from Marcos Lopez de Prado
Physical meaning:
High frequency financial data is voluminous and data hungry. E.g. 20 days worth of High frequency (tick by tick or trade by trade) financial data makes up 5 million records (Excel has an internal limit of 1 million records), and will make up a file size of 300MB.
Unless the data is summarised, we will quickly run into data processing limitations, as we process months/years of data.
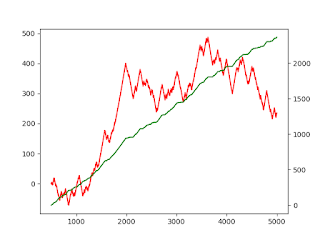
The data that appears, on financial charts, on popular websites, is such summarised data. Visually, we do not lose out on anything significant by working on such summarised data
Algorithm description:
The basic idea is to slice the raw high frequency data into slices, based on a consistent rule. Once we have prepared a slice, we summarise the slice, using statistics. A common statistic used by many is OHLC [Open Price, High Price, Low Price, Close Price]. Specifically, within the slice we just took, what is the price at which the slice started, what was the highest price reached within the slice, etc.
These summary statistics are then stored, and forms the basis to train a Machine Learning model.
1.1.1 Time bars: We take slices at a constant frequency, e.g. every 10 minutes
1.1.2 Tick bars: We take slices after a constant number of trades has passed, e.g. every 10,000 trades
1.1.3 Volume bars: We take slices after a constant traded volume is exchanged, e.g. every 10,000 shares
1.1.4 Dollar bars: We take slices after a constant financial amount is exchanged, e.g. every 10,000 dollars worth of shares


Python Code:
Are there any coding tips to improve speed/execution of the algorithm? Let me know in the comments.....
# Import Libraries
import numpy as np
import pandas as pd
import matplotlib.pyplot as plt

# Load data
df = pd.read_csv(r'C:\Users\josde\OneDrive\Denny\Deep-learning\Data-sets\Trade-data\ES_Trades.csv')
df = df.iloc[:,0:5]
df['Dollar'] = df['Price']*df['Volume']
print(df.columns)

# Identify threshold
def thresh(df,freq):
    tmp1 = pd.DataFrame(pd.pivot_table(df, index='Date', values='Symbol', aggfunc='count'))
    tmp2 = pd.DataFrame(pd.pivot_table(df, index='Date', values='Volume', aggfunc='sum'))
    tmp3 = pd.DataFrame(pd.pivot_table(df, index='Date', values='Dollar', aggfunc='sum'))
    tick_thresh = np.round((1/freq)*np.average(tmp1['Symbol']))
    volume_thresh = np.round((1/freq)*np.average(tmp2['Volume']))
    dollar_thresh = np.round((1/freq)*np.average(tmp3['Dollar']))
    return tick_thresh,volume_thresh,dollar_thresh

tick_thresh,volume_thresh,dollar_thresh = thresh(df,50)

# Generate bars
def bargen(df,tick_thresh,volume_thresh,dollar_thresh):
    tickprice = []
    volumeprice = []
    dollarprice = []
    tick_tmp = []
    volume_tmp = []
    dollar_tmp = []
    tick_count = 0
    vol_count = 0
    dol_count = 0
    for idx, (price,vol, dol) in enumerate(zip(df['Price'],df['Volume'],df['Dollar'])):
        tickprice.append(price)
        volumeprice.append(price)
        dollarprice.append(price)

        tick_count = tick_count + 1
        vol_count = vol_count + vol
        dol_count = dol_count + dol
        if tick_count == tick_thresh:
            o = tickprice[0]
            h = np.max(tickprice)
            l = np.min(tickprice)
            c = tickprice[-1]
            tick_tmp.append((idx, o,h,l,c))
            tick_count = 0
            tickprice = []
        if vol_count>=volume_thresh:
            o = volumeprice[0]
            h = np.max(volumeprice)
            l = np.min(volumeprice)
            c = volumeprice[-1]
            volume_tmp.append((idx, o, h, l, c))
            vol_count = 0
            volumeprice = []
        if dol_count>=dollar_thresh:
            o = dollarprice[0]
            h = np.max(dollarprice)
            l = np.min(dollarprice)
            c = dollarprice[-1]
            dollar_tmp.append((idx, o, h, l, c))
            dol_count = 0
            dollarprice = []
    cols = ['Index','Open','High','Low','Close']
    tick_bar = pd.DataFrame(tick_tmp,columns = cols)
    volume_bar = pd.DataFrame(volume_tmp,columns = cols)
    dollar_bar = pd.DataFrame(dollar_tmp,columns = cols)
    return tick_bar,volume_bar,dollar_bar
tick_bar,volume_bar,dollar_bar = bargen(df,tick_thresh,volume_thresh,dollar_thresh)
print(tick_bar.shape,volume_bar.shape,dollar_bar.shape)
Comments
Post a Comment